How to effectively use S-parameters in RF design S-parameter measurement is one of the basic methods in the RF design process. These measurement results can be used in today's computer-aided design (CAD) tools as part of the circuit simulation process. The S parameter describes the component as a black box and is used to simulate the behavior of electronic components at different frequencies. S-parameters are often used in active and passive circuit design and analysis. This article focuses on how to use CAD methods to incorporate S-parameters into the design process. S-parameters have been widely used in circuit simulation since its inception. Synthesis and analysis tools for RF and microwave applications almost all promise the ability to simulate with S-parameters. We can find S-parameter modules in many simulators, and designers will set the value of each specific S-parameter. The following examples further illustrate how to use S-parameters for low-noise amplifier (LNA) design. S-parameters provide necessary data for stability analysis and gain loop analysis. However, LNA design also requires small-signal noise parameters (such as Nfmin, Sopt, and Rn) in order to be able to construct the noise loop needed to provide a specific noise figure in the simulator. The table gives a set of S and noise parameters measured at 1 GHz. s-parameter calculation / s-parameter calculator. All simulations mentioned in this article use Agilent's Advanced Design System (ADS). Fig. 1 is a circuit schematic diagram including S parameters and noise parameters. After the simulation is performed, the data can be post-processed to obtain the information needed to design the LNA (Figure 2). This analysis shows the powerful performance and versatility of using S-parameters. In the actual design process, this process is very useful because the vector network analyzer (VNA) can be used to measure S-parameters and then use the parameters in the simulation. To extend this basic capability, S-parameters measured at different frequencies can be saved in a format supported by the emulator. Two file formats that can be created by VNA and used by ADS are ciTIfile and touchstone. This method has higher flexibility than single-point S-parameters. In actual work, for various devices that cannot use existing SPICE or compact models, design engineers will obtain data from component manufacturers or obtain data through laboratory measurements. This article will mainly discuss the touchstone file format because it is the more popular of the two formats. Design engineers can find various S-parameter measurement results provided by manufacturers on the Internet, and may also obtain the measurement data archived by their companies. This is usually a good start, but these data are usually measured in a different environment than the final application environment. This may introduce large errors in the simulation. For example, when capacitors are mounted on different types of printed circuit boards, the capacitors will have different resonant frequencies due to mounting pads and circuit board materials (such as thickness, dielectric constant, etc.). Solid-state devices also encounter similar problems (such as transistors in LNA applications). To avoid these problems, when performing parameter measurements in the laboratory, it is best to assemble the device on the same PCB as the PCB to be produced. Figure 3: S-parameter result of the inductor (a) and S-parameter result of the SAW filter (b). When using touchstone files, design engineers also need to consider the situation where the simulation frequency is occasionally outside the range of the data file. The software can provide a mechanism to extrapolate data or stop the simulation, because there is no valid data in part or all of the frequency range. Two popular extrapolation techniques are: (1) using the closest known data point and constant extrapolation; (2) using the two closest known data points for linear extrapolation. The results obtained by these two extrapolation techniques are approximate. If the data points are not selected properly, there will be a large error, and even the simulation will not converge. Figure 3 shows two examples. In the example in Figure 3, both data files have data in the 50MHz to 6GHz frequency range. In the S-parameter results of the inductor, linear extrapolation produces an inflection point at 50MHz, which is not consistent with the expected inductor characteristics. When a linear extrapolator is used, the surface acoustic wave filter exhibits a "gain" mutation at about 8.5 GHz, which is not possible with passive components. The user needs to know the useful frequency range in the touchstone file and select the appropriate extrapolator. Another way to solve this problem is to manually add the DC point or high frequency value to the touchstone file. This method can eliminate the risk of incorrect extrapolation. A very important feature of the S-parameter data file is that the simulator should also have interpolation capabilities within the data range, but the premise may be that very close data samples are required within a specific response range, otherwise the important characteristics of the response may be completely lost ( For example, the resonance of a high-Q circuit). In this case, the design engineer should first make broadband measurements, then focus on the narrowbands of interest to them, make a second measurement with a higher frequency resolution, and finally combine these files manually. These files are ASCII data files and can be edited with any text editor. Large signal S parameter The previous discussion defined the default S-parameter to be linear by definition. For CAD users, this means that the device is either a passive device or is assumed to work within the linear range of the simulator's response. Therefore, for S-parameter analysis, even if measured under the excitation of a large signal, the output will not generate harmonics. So, how effective are these large-signal S-parameters in the design process? When no other models are available, S-parameters provide a black-box circuit description, even for large-signal analysis. One advantage of using S-parameters in large-signal analysis is that you can obtain a data file containing S-parameter measurements, which are a function of power and frequency (also called large-signal S-parameters). In the ADS emulator, it is completed by P2D files. The P2D file is called by a special emulator component called Amplifier P2D. P2D files are better than large signal touchstone files, because by definition, touchstone files are used for small signal power levels, while P2D files provide S-parameters at different frequencies and powers. The software can be used to easily create measured P2D files. In other words, the software can control the instrument and generate P2D files. P2D files can also be created from simulation results. The following analysis examples illustrate the effectiveness of the P2D data model. First, we analyze the relationship between the output power of the power amplifier (PA) and the input power at a fixed input frequency, as shown in Figure 4a. P2D files can also be used to simulate the relationship between output power and frequency, as shown in Figure 4b (fixed input power). Another great use of P2D and touchstone files is system-level analysis. For example, sometimes you need to look at the output after connecting the above PA and the dual multiplexer (represented by a touchstone file). The circuit diagram and analysis results are shown in Figure 5. These data files can also be used by the modulation source in the circuit envelope simulation. The P2D file is a short description of the performance of the device under test (DUT) under single tone excitation, so it can be considered as a tuning model. This means that when design engineers use Amplifer P2D components in ADS, they only get the S parameters at the frequency defined by the component (remember: there are no harmonics at the output). Therefore, a very wide modulation bandwidth may cause large errors, especially when adjacent channel measurement results are also useful. For example, Figure 6 is the output of a modulated carrier that is fed to a P2D model and a discrete circuit model. It should be noted that within the modulation bandwidth there are two signals that appear to be the same. As the signal moves away from the carrier frequency, the spectral density of the two signals becomes different. Another very important benefit of using Touchstone files and P2D files is the ability to understand the design performance earlier. In the early stages of the project, the system engineer may need to estimate the link budget tolerance and understand the PA performance. A typical method is to use spreadsheet-type parameters such as gain, 1dB compression point, IP3, etc. This has always been the mainstream method. But now, with just one file, the actual measured performance can be obtained and applied to the analysis process. A good example of this is that P2D files can provide higher accuracy than spreadsheets. Another method of use may involve the protection of intellectual property rights. P2D files and touchstone files can be generated directly from the emulator. Therefore, during circuit design, IC manufacturers or design teams can also provide design data to the system design team or customers to determine whether the proposed design meets the requirements of the entire system without having to wait until the actual hardware is produced. The accuracy of the data model file is the key to the success of this method. The measurement-based file has the same accuracy as the measurement result, and should simulate the actual system design conditions (bias, temperature, etc.) as much as possible. Please note that if the design is a time-varying circuit (such as a power control loop), or there is a strong memory effect, they cannot be recorded or included in the P2D model. Understanding how to use touchstone and P2D files is very useful for RF circuit design. In addition, P2D files can also increase simulation speed. In very complex design simulations, the P2D look-up table makes designs using P2D models several orders of magnitude faster than discrete designs. Author: Wilfredo Rivas-Torres; EEsof EDA Application Engineer department; Email:; Agilent Technologies
Our Led Industrial Lighting are designed to provide optimal lighting for factories,warehouse,manufacturing plants,distribution centers,parking garages and gyms.etc..We have Led High Bay for indoor use,and UFO high bay with IP65 for outdoor use.Our main technology is in the radiating fins design.The riveting process for the radiator plate and fins is mainly installed in the mold fixture,each module comprise a plurality of fins,and with a predetermined gap between adjacent fins,and the fins can be inserted into the positioning mould,by interlacing the fins and the adjacent punch,the plate is with trench to positioning in metallurgical equipment,stamping equipment impact the back of the base plate to make the fins riveting consolidation,Through the implementation of the above technology,the stamping riveting method is better than the traditional radiator processing,it is highly effective and reduce the mould broken, and provide precision and high quality products.
Led Industrial Lighting Led Industrial Lighting,Led Industrial Light,Industrial Outdoor Lighting,Industrial Led Lighting Guangdong guangzhidian lighting Co., Ltd. , https://www.gzdlighting.com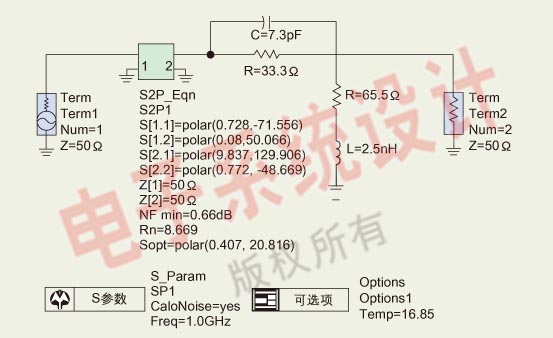
Figure 1: S-parameter simulation circuit diagram including noise analysis settings. 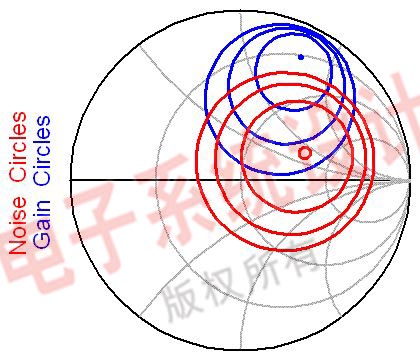
Figure 2: The noise loop and gain loop information required to design an LNA. 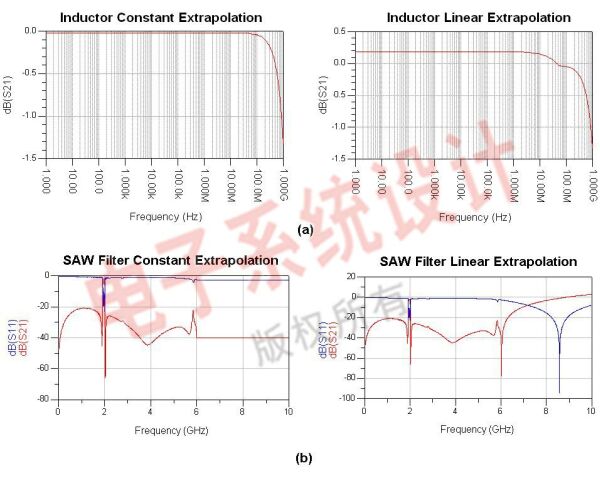
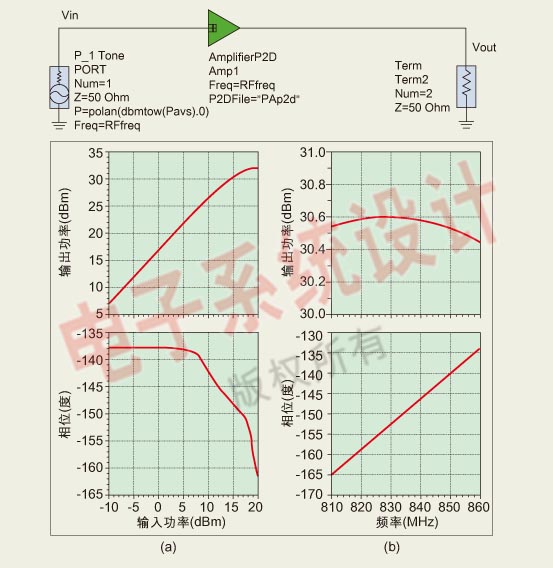
Figure 4: (a) AmpliferP2D power scan results; (b) large signal frequency scan results. 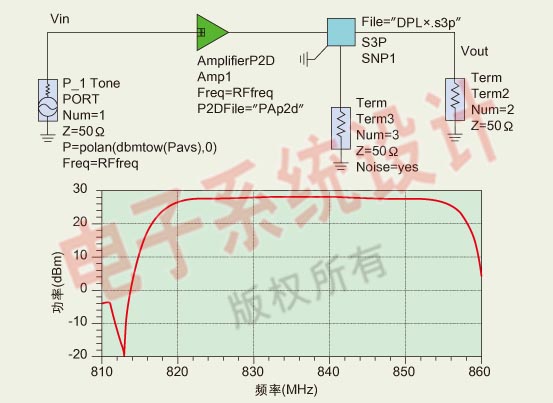
Figure 5: Simulation results of the PA and dual multiplexer circuit. 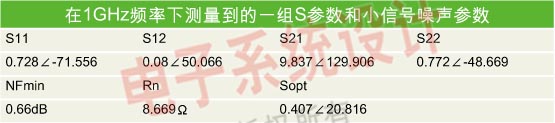
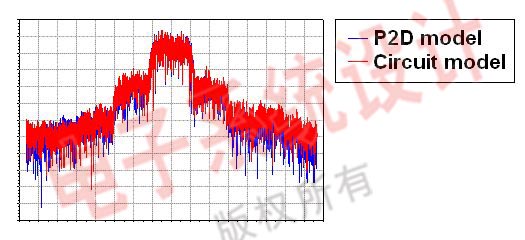
Figure 6: P2D file simulation results using modulated signals.