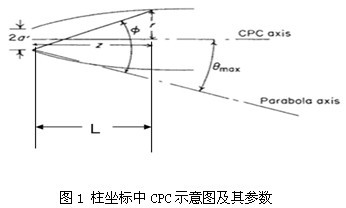
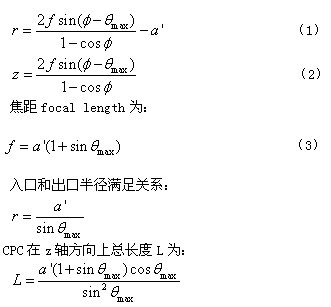
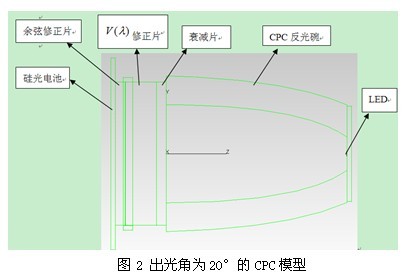
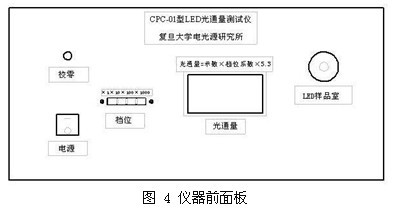
1 Introduction Due to the potential high luminous efficiency, long life, small size and environmental protection of LED, its application in the field of general lighting has developed rapidly, and it has a tendency to replace traditional light sources. Luminous flux data is not only important for determining the efficacy of LEDs, but is also indispensable in the marketization of LEDs and the replacement of traditional light sources. There is therefore a need for an accurate and simple method of measuring luminous flux. The current methods for measuring LED luminous flux can be divided into absolute method and relative method. The absolute method generally uses a distributed photometer to test the spatial distribution of the luminous intensity of the light source, and then calculates the total luminous flux by software integration. The absolute method is relatively accurate, but the test takes a long time, the equipment is complicated, and the maintenance cost is high. The relative method is a method of comparing the measured LED with a standard light source with a known total luminous flux to obtain a total luminous flux. The commonly used instrument is an integrating sphere. This method is simple and fast, but requires a similar spectral power distribution for the lamp under test and the standard lamp. In addition, since the LED is different from the traditional light source, the light intensity varies greatly with angle, and the difference of the light distribution of different types of LEDs is also great. When the spatial light intensity distribution of the measured lamp and the standard lamp are different, the space is uneven. Sexual error. Moreover, when the volume of the integrating sphere is small, the self-absorption effect is severe and the measurement error is large. The use of a large volume integrating sphere can obtain relatively accurate results, but the volume is too large to be industrialized. The new LED luminous flux tester developed in this paper uses a compound parabolic collector to collect the light emitted by the LED light source, and then uses a large-area silicon photodiode to detect the emitted light. In order to verify the feasibility of the tester, a new tester was used to measure the white light and green light, a total of 8 high-power LEDs were measured, and then compared with the measured luminous flux of the photometer, the relative error was within ±3.5%. . And the use of innovative measurement methods to analyze the causes of the error. 2 new LED luminous flux tester In this paper, the luminous flux tester CPC-01 is established by using the LED light flux test method of Compound Parabolic Concentrator (CPC). The luminous flux test system using CPC is small in volume, and the CPC reflective bowl has a volume length of about 4 cm and a diameter of about 7 mm. And the test is fast, the data can be read immediately after the LED is stable [3]. In comparison, spatially, the distribution photometer requires a black chamber, the diameter of the conventional integrating sphere is at least 20 cm, and the smaller the sphere size, the greater the error; in time, the photometer is distributed for at least 2 hours. 2.1 Principle of CPC for Luminous Flux Testing CPC is a non-imaging concentrator designed according to the principle of edge optics. Often used for solar energy collection. The optical axis of the parabola is rotated by a certain angle around its own focus, and then a two-dimensional CPC is obtained through translation and symmetry, and then rotated around the axis of symmetry to form a three-dimensional CPC [4]. As shown below: Figure 1 CPC diagram and its parameters in cylindrical coordinates In the above figure, φ is a variable parameter, α' is the outlet diameter, and r is the inlet radius. Θmax is the maximum incident angle. The contour equation using the cylindrical coordinate system is: As long as the angle of incidence of the light incident from the entrance port with respect to the central axis of the CPC is less than θmax, it is possible to reach the exit port after a maximum of one reflection, and to function as a concentrated light. The energy collection rate is the highest for incident rays with a relative central axis off angle less than θmax. According to the principle of optical reversibility, the LED light source is placed at the exit port of the CPC, and the light emitted by the light source must be reflected and emitted from the entrance. At the same time, the maximum angle of the emitted light is θmax, so that CPC plays the role of collecting light. At the same time, almost all of the light reaches the entrance through only one reflection, so the light utilization of this CPC is much higher than other types of concentrators. In the tester described in the paper, the CPC uses a CPC reflective bowl with a light exit angle of 20°, the focal length f is 4.7 mm, the diameter of the exit port 2a' is 7 mm, and the diameter of the entrance port 2r is 20 mm. An attenuator, a cosine correction and a V(λ) correction are added between the CPC and the silicon photodetector. Using the tracepro to simulate the Lambertian LED light source, the simulation parameters were set as follows: The reflectivity of the CPC inner wall coating was 98%. The attenuation sheet has a diameter of 30mm and a thickness of 2mm. The transmittance of light for all wavelengths is 10%, and the absorption rate is 90%. The function of the attenuation sheet is to ensure that the emitted light completely falls within the detection range of the photocell and reduces V ( λ) The effect of the reflected light of the correction sheet. The V(λ) correction sheet has a diameter of 30 mm, a thickness of 6.5 mm, and a reflectance of 5%. The cosine correction piece is also 30 mm in diameter and 2 mm in thickness. The bulk scattering performance is described by the ABg BSDF (bidirectional scattering distribution function) model, and the total BTDF is set to 99%. The detector has an area of ​​40mm*40mm and a reflectivity of 15% for all wavelengths. As shown in Figure 2: Simulation of a single ray at different angles of incidence with a relative error of less than 5%. A narrow beam source with a half-light intensity of 15° is simulated, and the Lambertian source has a relative error of less than 2%. The relative error is less than 1.5% when the LED deviates from the center point of the focal plane by ±1 mm. 2.2 Establishment of the actual system The schematic diagram of the new luminous flux tester CPC-01 is shown in Figure 3. Different configurations of fixtures are used to match the visible light LEDs of different package forms to ensure that the illuminating center of the visible light LED is positioned near the bottom end of the CPC concentrator (ie, the focal plane of the CPC). The CPC fixture integrates the heat sink. A CPC reflector is used as a light flux collecting device for the visible light LED to be measured, and a high reflectance silver reflective film is deposited on the inner wall of the reflector. A large area (48*48mm) silicon photocell is used as the detector, and the attenuation plate, V(λ) correction plate and cosine modifier are sequentially installed between the CPC light exit port and the light receiving surface of the detector. The output signal of the detector is converted by current and voltage, and amplified to obtain the final indication [3]. The parameters of each part of the actual system are consistent with those in 2.1. The new luminous flux tester CPC-01 is a rectangular box with length, width and height of 374mm, 206mm and 70mm respectively. The front panel is shown in Figure 4. The range is: 0.01 lm ~ 50000 lm The picture above shows the front panel of CPC-01. The “zero calibration†on the panel is the zero calibration knob; the “power supply†is the power switch; the “gear position†is the shift button, and the corresponding gear position is marked with the gear coefficient ×1,×10 , ×100, ×1000; "Luminous flux" is the luminous flux display window, the number is multiplied by the corresponding gear coefficient and calibration coefficient to be the final luminous flux measurement value; "LED sample chamber" is the placement of the LED fixture. The measured luminous flux of the LED is compared with the standard LED: Among them, φT and φR are the luminous fluxes of the LED to be tested and the standard LED, respectively. iT and iR are the silicon photocell detector signals of the LED under test and the standard LED, respectively. However, due to process limitations, oxidation, etc., the inner wall of the CPC cannot be a uniform ideal diffuse reflection layer, and the diffusion coefficients of the inner walls are not completely equal. Therefore, when the spatial intensity distribution of the measured lamp and the standard lamp are inconsistent, it will be introduced. Uneven distribution of spatial distribution. Secondly, the modified detector and the V(λ) curve are not completely consistent. When the measured lamp and the standard lamp have different spectral power distributions, the spectral mismatch error is introduced. This paper will combine the remote GO-R3000 distribution photometer, integrating sphere and remote PMS-80 UV-Vis-NIR spectroscopy system to analyze the error from the above two aspects.